Object Analysis Dialog
The Object Analysis dialog includes a left-side panel with controls for selecting objects, creating classes, and splitting clustered objects, as well as a large area on the right in which analysis data can be viewed as a table or graphed for easy filtering (see Working in the Histogram View and Working in the Table View for information about these two modes).
Right-click a multi-ROI with scalar values and then choose Analysis in the pop-up menu to open the Object Analysis dialog, shown below.
Object Analysis dialog
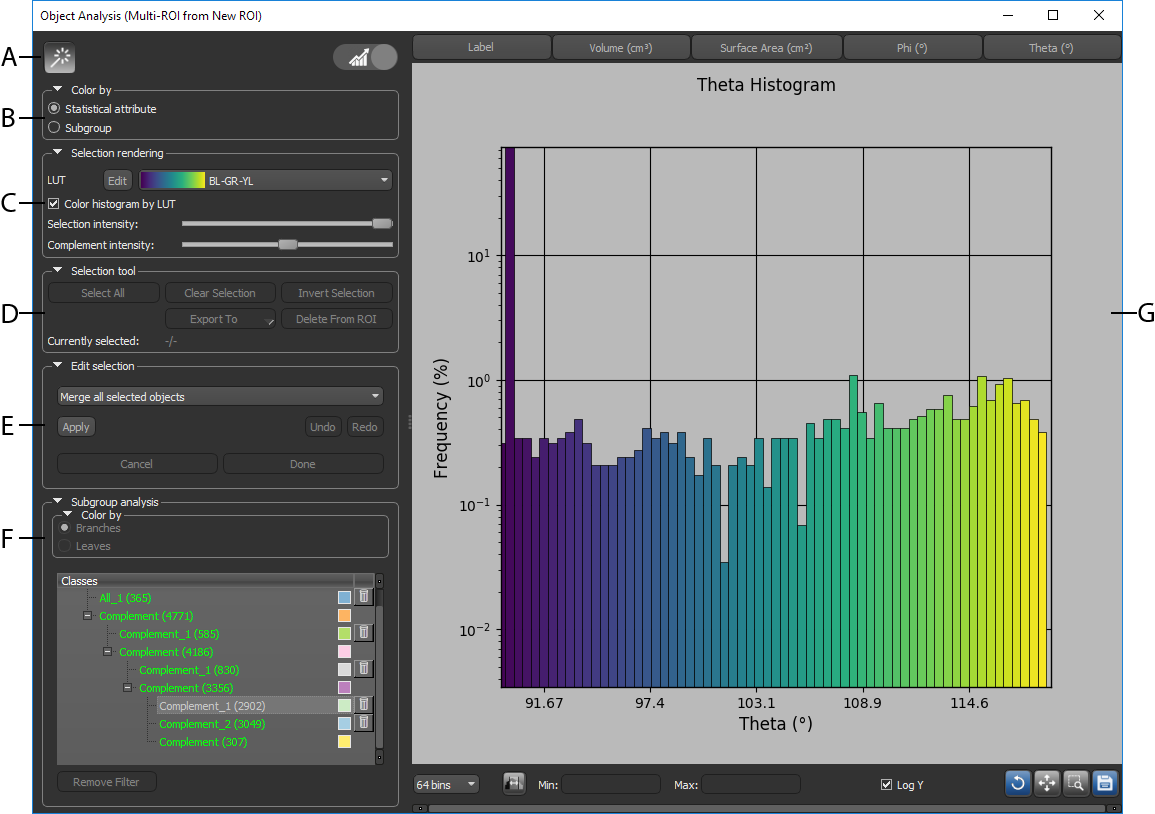
A. Object Analysis tools B. Color by options C. Selection rendering options D. Selection tools E. Edit selection options F. Subgroup analysis G. Table/Histogram view
The tools available at the top of the dialog let you enter Pick mode and toggle between the table view and histogram view.
| Icon | Description | |
|---|---|---|
| Pick mode |

|
Lets you select objects directly in a view, as described below. You should note that whenever you work in Pick mode, you must make sure that the multi-ROI is selected in the Data Properties and Settings panel. Add to selection… Ctrl-click an object to add it to a selection. Remove from selection… Shift-click an object to remove it from a selection. Deselect all objects… Ctrl-click or Shift-click any part of the image without an object to de-select all objects in a selection. |
| Toggle view |


|
Toggles the dialog between Table view and Histogram view (see Working in the Histogram View and Working in the Table View for information about these two modes). |
The options available here let you choose how views of the multi-ROI will appear in the scene views.
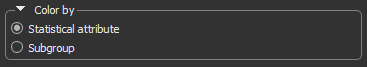
Color by box
| Description | |
|---|---|
| Statistical attribute | If selected, the LUT colors corresponding to the values of the selected statistical attribute will be applied. |
| Subgroup | If the selected, the colors corresponding to the assigned classes or sub-classes in the Subgroup analysis box will be applied (see Subgroup Analysis). |
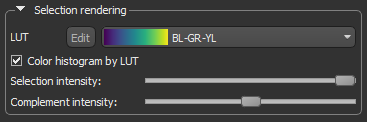
Provides options for selecting and editing the applied LUT and for modifying the selection intensity in the scene views.
Selection rendering box
| Description | |
|---|---|
| LUT |
Allows you to select a Look-Up Table (LUT) function, which determines how colors are applied to the values of statistical attributes in the scene views.
Note Whenever 'Label' is displayed as the scalar measurement for a multi-ROI, the selected LUT will be applied as a periodic or cyclical color map. This means that when labels are mapped to a color map of k discrete colors, labels 1 through k are be mapped to those colors. Labels k+1 through 2*k are mapped to the same colors, while labels 2*k+1 through 3*k are mapped to those same colors and so on. This periodic (or cyclical) color map should make it easier to visually resolve different labels in a multi-ROI. |
| Color histogram by LUT | If checked, the selected LUT will be applied to the histogram. If left blank, the default histogram colors will be applied. |
| Selection intensity |
Determines the opacity of selected objects in the scene views of the multi-ROI.
|
| Complement intensity |
Determines the opacity of unselected objects in the scene views of the multi-ROI.
|
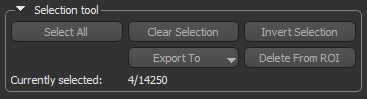
Provides options for selecting objects, exporting selections, and deleting selections from the multi-ROI.
Selection tools box
| Description | |
|---|---|
| Select All | Selects all objects in the multi-ROI. |
| Clear Selection | De-selects all objects in the multi-ROI. |
| Invert Selection | Inverts the current selection. |
| Export To | Provides options for exporting selected objects to a region of interest, multi-ROI, or as data in the comma-separated values file format (*.csv extension). |
| Delete from ROI | Deletes the current selection from the multi-ROI. |
| Currently selected | Indicates the number of objects currently selected and the total number of objects in the multi-ROI. |
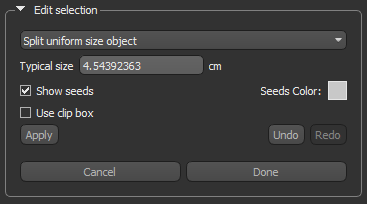
The options available here let you merge selected objects as well as split clustered objects (see Splitting and Merging Objects).
Edit selection box
Provides options for creating and managing classes and sub-classes from objects that share specific characteristics.
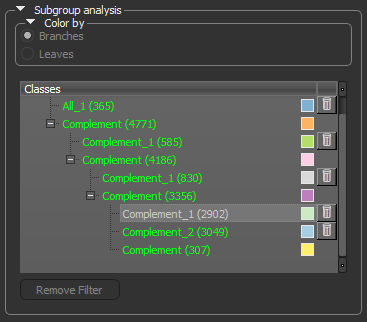
Subgroup analysis box
| Description | |
|---|---|
| Color by |
Determines how colors are applied to the objects in the multi-ROI in the scene views and in the Histogram view. You should note that Subgroup must be selected in the Color by box at the top of the panel to access the following settings.
Branches… If selected, the colors of the branches (classes) will be applied. Leaves… If selected, the colors of the leaves (sub-classes) will be applied. |
| Classes |
You can automatically create classes and sub-classes to group objects that share specific attributes in either the Table or Histogram view (see Working in the Table View and Working in the Histogram View for information about these two modes).
You should note that you can rename a class by double-clicking its name and then entering a new name in the edit box. Pop-up menu… A pop-up menu is available for each class to export the objects within the class to a new multi-ROI or as data in the CSV format. You can also delete the objects in a class from the multi-ROI. |
| Remove Filter | Available to move objects in the leaves up to their corresponding branch. |
You can conduct an analysis in either the Table view (see Working in the Table View), in which data is presented in a standard table-structured format, or in the Histogram view, in which selected attributes are plotted on a histogram (see Working in the Histogram View).
